Home Value Patrol
Correlating crime rates and property value in neighborhoods
In 10 weeks of Fall 2015, we worked on finding out the effect of increase in crime rates in a neighborhood to its property value using Seattle's 911 calls dataset and Zillow's House Value Index (ZHVI).
Type
Group project with Akashdeep Jaswal, Aparna Dharmakkan, Varuna Damodaran.
Project Aspects
Data Science, R coding, Data Visualization, Research
My Role
Research, exploratory data analysis, linear regression model, R
Contributed to data visualization, reporting and presentation
Timeline
Aug - Dec 2015 (10 weeks)
Project Goal
Our project is an attempt to understand how property crime affects the home value or sale price of houses in a particular neighborhood over time. In order to understand this, we have retrieved data from two sources:
We expected our project results to look like this:
Home value or property value should have a negative relationship with crimes such as arrests, burglaries, robberies in the neighborhood
Some crimes in a neighborhood may have no significant relationship with the property value
Our model should be extendable by using several other variables which could have a significant effect on the relationship between property values and crime; such as proximity to public transportation, schools, offices, departmental stores, etc.
Deliverables
We submitted a report in the class of Introduction to Data Science (INFX 572) at Information School, University of Washington, Seattle. We also presented our work using the above slide deck. Our group was given the highest grade and was the top rated project in the cohort. We received bonus points for beyond the scope impact analysis and thoroughness of the project.
Process
preliminary analysis and research using statistics
Scatter plot showing correlation between the count of Burglaries and ZHVI data
We prepared statistical evidence about the impact level of each crime on the dataset. Before we could do an in-depth research on establishing correlations between various attributes of these datasets, we ran a basic linear model on a sample set of 50 random values from each dataset. The correlation between the Count and ZHVI was -0.155142 and R-squared value was found to be 0.024, indicating the model was not comprehensive but there was a definite correlation between the two.
data cleaning
For establishing common point (neighborhood) between two datasets, we did the following:
Removed unwanted records and columns
Identified neighbourhoods from Seattle’s 911 Incident Response dataset
Matched neighborhoods between datasets
Aggregated and merged cleaned datasets
exploratory data analysis
multiple linear regression model
We then created a multiple linear regression model in R using Home value as the outcome for a function of all the five types of crime (Assault, Burglary, Arrest, Disturbance and Robbery count) as the predictors.

We determined from our results that there are two variables deviating from the expected negative effect - Disturbances count and Assaults count had a positive relationship with the home value index. We ran a multiple linear regression again without these confounding variables.
Tested variables for collinearity
Interpreting the results of research
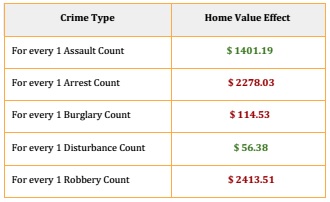
The results show negative relationship (marked red) indicating that increased number of these crimes cause the home values to go down, based on the slope value interpretation in this study.
The results show a positive relationship (marked green) indicating that these crimes cause an increase in the values of homes in a given neighborhood, based on our study.

To explain why assaults have a positive relationship with crimes, we found that 4471 of total 17523 assault cases reported in Downtown Seattle (25% of the total) - Since the volume is large, this was affecting the overall model largely. And we assume that the value in Seattle Downtown are always on the rise, assaults do not affect them.
Final Thoughts
This project provided us with an insight into how the world of data science actually works. The fastidious level of detailing and critical thinking required for performing such researches has enabled me to question every data I see. This project has also proved to me the significance of data visualization for effective data analysis.
The comprehensive report submitted at the end of the project showcases the nuances of various terms used and intricacies of our decision making process throughout this project.